
INTERACTIVE DASHBOARDS
See your business clearly, at any angle
Dashboards that visualize and combine data sources in real time to show related data side by side. You get an in-depth, hands-on understanding of your business from a perspective that only Press Ganey can bring.
Dashboards that move and
flex with you
Flexible filtering
Dynamic filters mean a dashboard is never just a dashboard. It can show you different worlds of information depending on what you ask of it.
Decode your data, visually
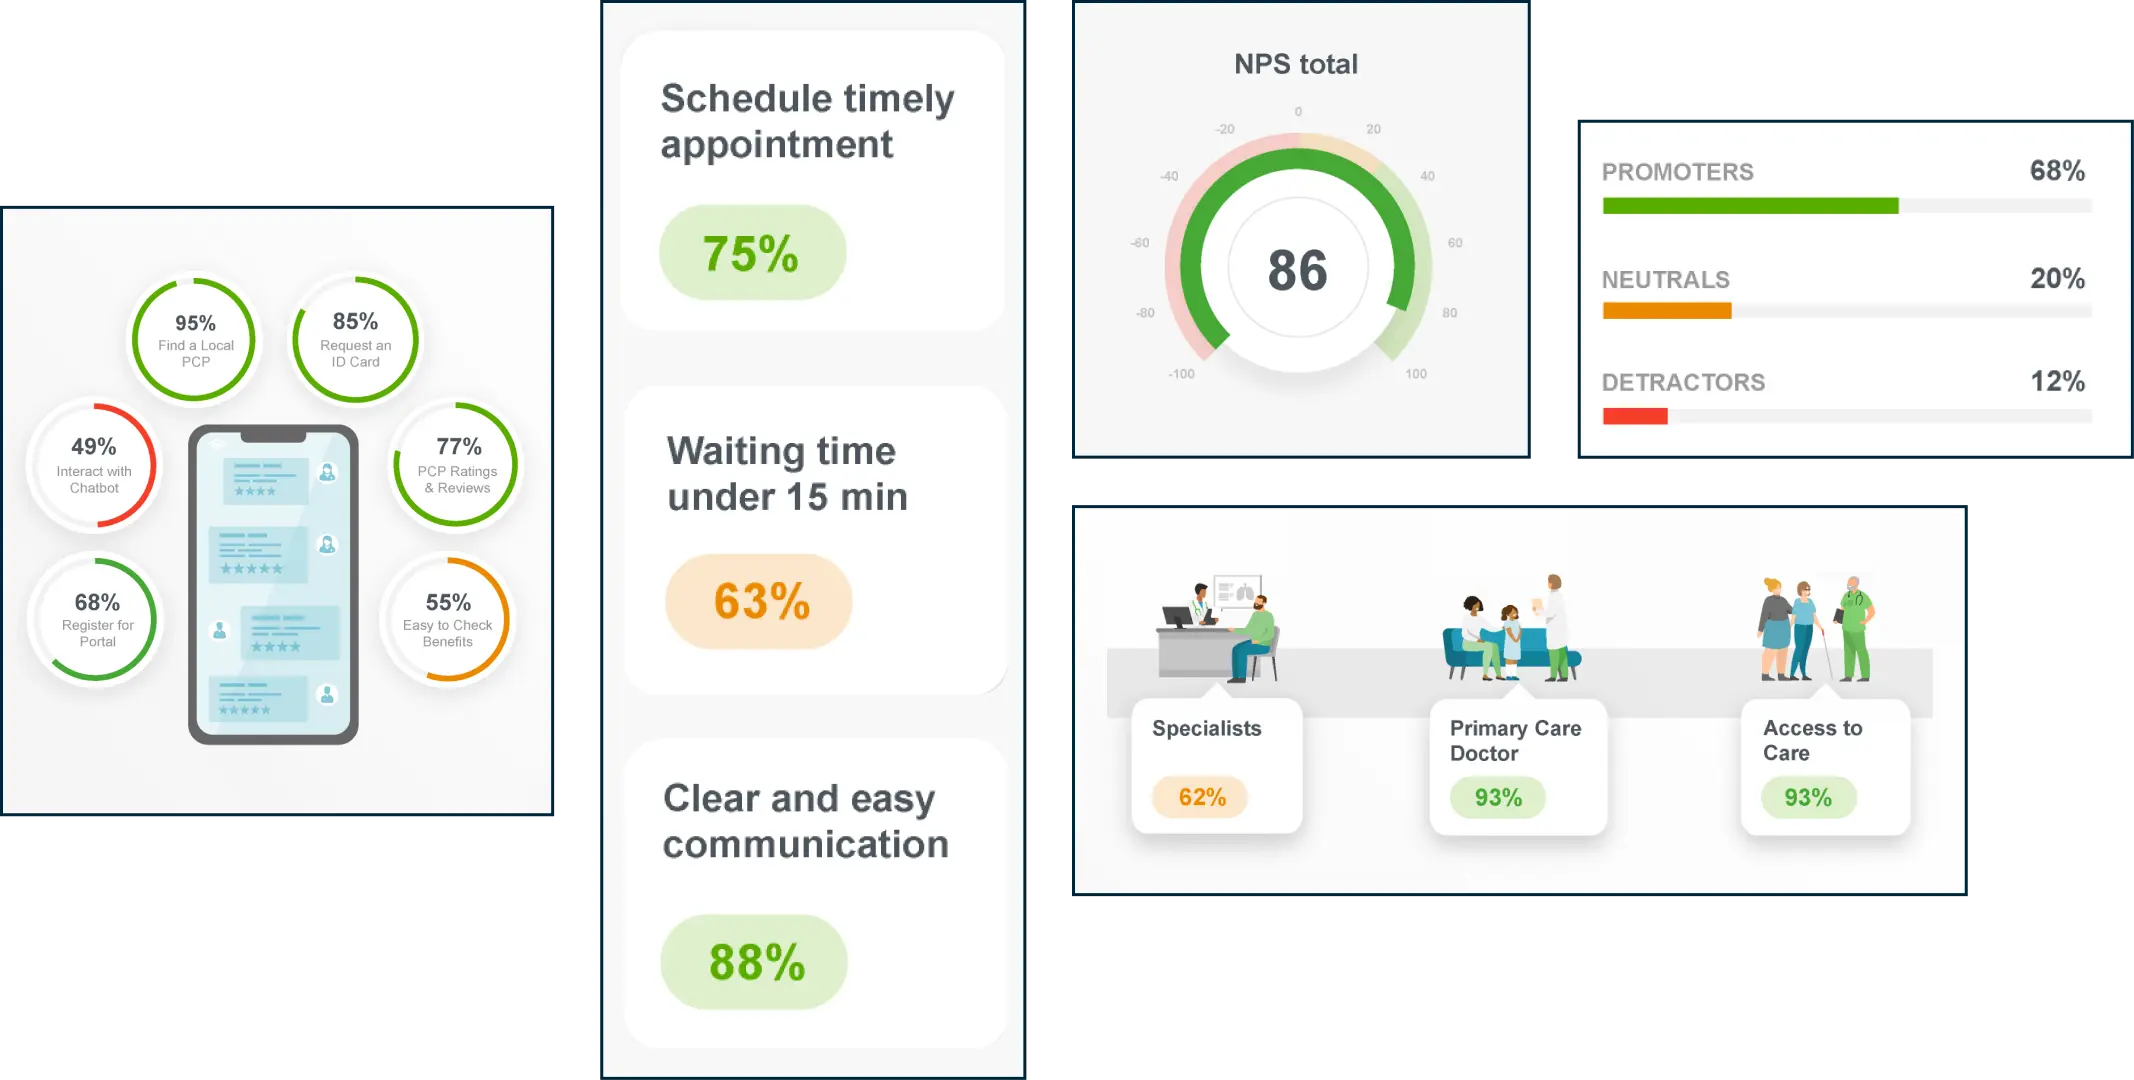
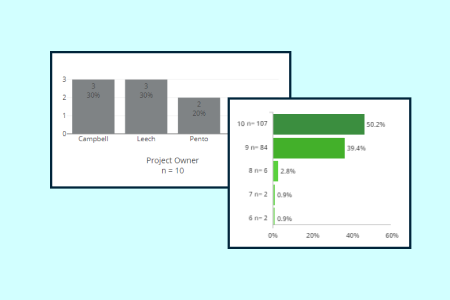
Data visualizations give you powerful insights with living visuals that update instantly and automatically, allowing you to share your vision internally.
Dashboards that tell the whole story
Visualize entire systems down to the detail. See how you stack up to competitive benchmarks. All thanks to fine-tuned reporting at your fingertips.
Living, breathing data and dashboards
Dashboards update themselves with each fresh wave of data, so you know what’s happening as it’s happening, 24/7.
EFFECTIVE REPORTING
Connect the dots
Get a holistic understanding of how critical performance elements ebb and flow and influence one another. Our dashboards allow you to zero in on the “why.”
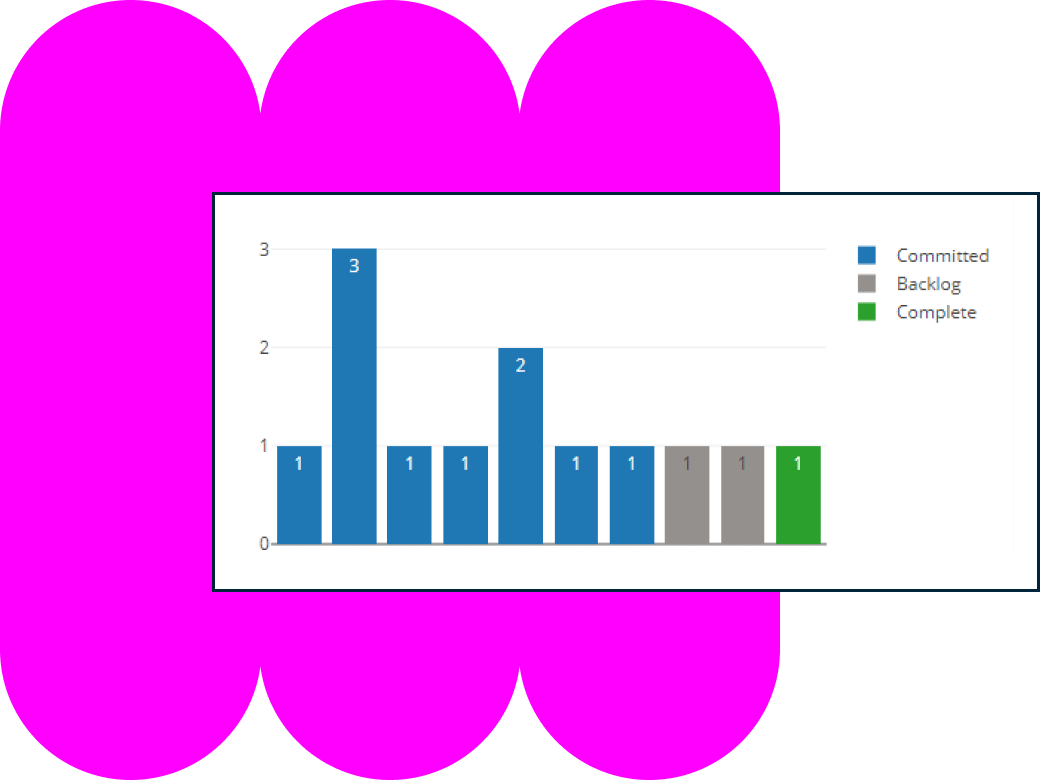

INTERACTIVE DASHBOARDS
Go for the million-mile view, or get down to the millimeter
Our dashboards provide a top-down view of your most complex data. They let you focus on the tiniest piece of the picture, so you get the results you want. Pinpoint both your successes and your shortcomings to direct resources with confidence and efficiency. Then act.
Giving you the tools to make a difference
Your biggest challenges meet our best solutions
visualize
Data visualizations
gather
Continuous listening
gather
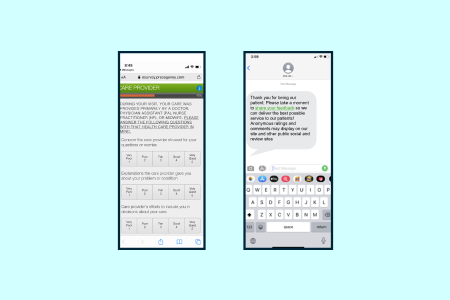
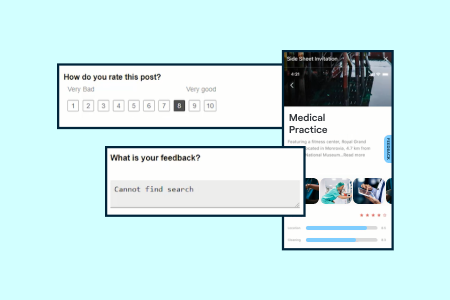
Digital feedback
visualize
Interactive dashboards
interactive dashboards
Data and dashboards that dance together
